Get a grip on Growth Potential
Tracking the growth rate of your turf gives the opportunity to assess how plants are performing at any given time, and the implications for almost all management actions. This measurement is not new, for generations greenkeepers have been inspecting box clippings to assess daily growth. Comparing the volume of clippings in a box to yesterday or the week before can keep you ahead of the curve.
Considering the importance of this element for turf management, it’s no surprise that people have sought to improve the quality of this important metric, with the development of Growth Potential models, that link temperature to patterns of turf growth. Which also brings the opportunity to look at predicting future growth.
In typical UK temperature conditions, which are highly favourable for growing cool season grass species, the Growth Potential, or GP, curve tends to kick off in early spring, peaks around July, before dropping away into winter.
However, for every site, every year the temperature will be a limiting factor for growth at many times of the year, the shape of that GP curve will be different in the timing and duration for each site.
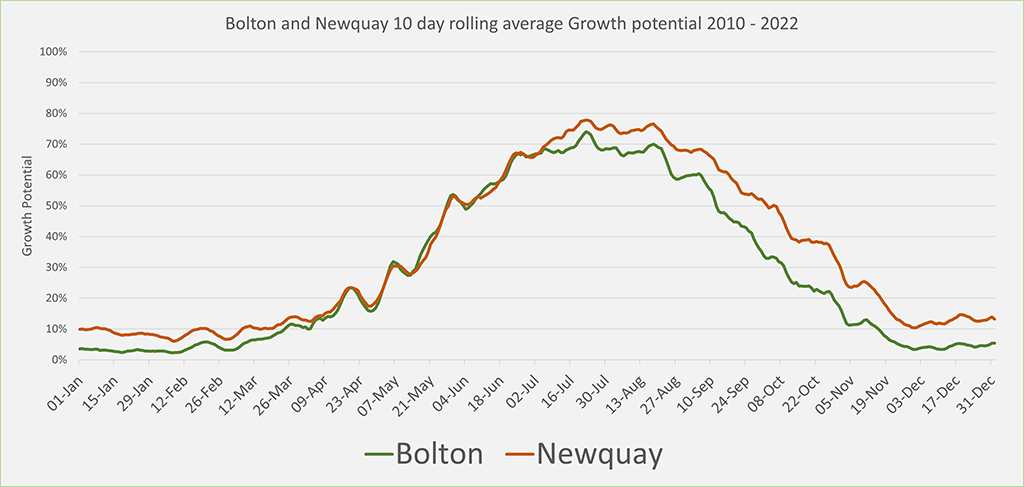
The Growth Potential model has the ability to highlight in advance when these difficult periods will occur, helping to plan better to manage them.
Where can Growth Potential be incorporated into turf management decisions?
- Maintenance timing and actions
- When to start and end of PGR programmes
- Fungicide selection
- Biostimulant timing
- Nutrition strategy
- Communication with club managers and players
- Selecting the best period of the year for renovation recovery
The new Syngenta Turf Advisor app provides greenkeepers and advisors with the current daily GP figure for their course, along with a graphic of recent days - that will be influencing the state of turf plants now - and a rolling forecast of GP for the coming week. Furthermore, it includes an average GP for the two-week period we are in and how that compares with the long-term historic average for the same period.
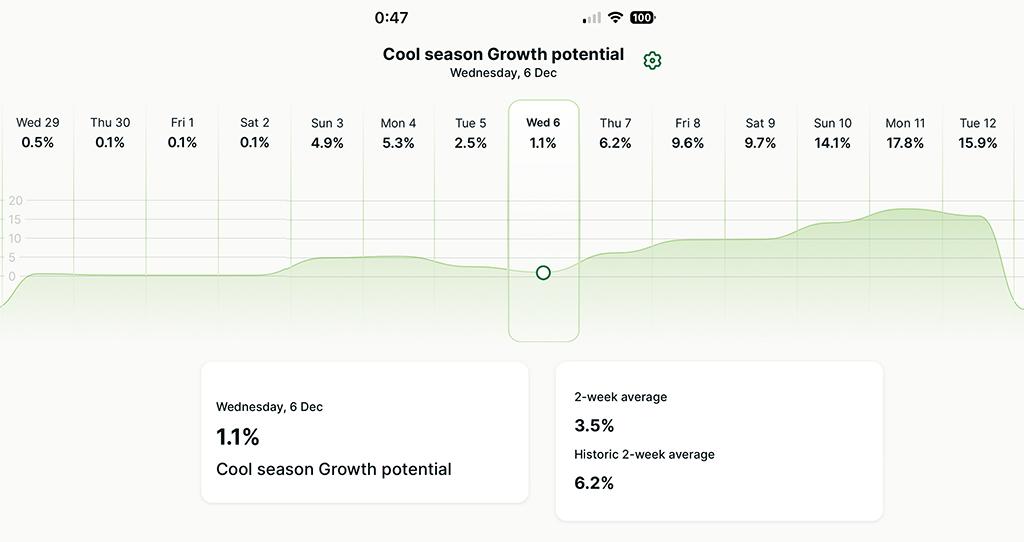

However, it must be recognised that the pattern of GP may not be represented in real-time grass clipping yield measurements - which highlights both the flaws in the model and the importance of tracking both metrics.
In the UK we can see stresses impact our turf, such as the typical slow down of growth with a dip through the summer - but they are rarely temperature stresses. The downturn we see in summer growth is normally related to high evapotranspiration rates, drought stress and extreme light levels. While we are seeing a generally warmer climate, we still rarely move into periods of prolonged heat stress - although that may become more likely every year.
Comparing GP figures to the actual growth helps understand the impact of the other stresses involved and assess the resilience of turf plants to all stresses, along with the ability for them to recover – and how that can influence proactive timing of turf management activities.
GP model numbers
Initially developed in the US, the Turf Advisor GP model premise is that growth of cool season grasses begins to get going at a 24-hour average temperature of around 5⁰C , builds rapidly at temperatures from 10⁰C to 17⁰C, and peaks at a temperature of 20⁰C. When average temperature exceeds that peak, the growth begins to slow down again - to a point of little activity above a daily average of 32⁰C.
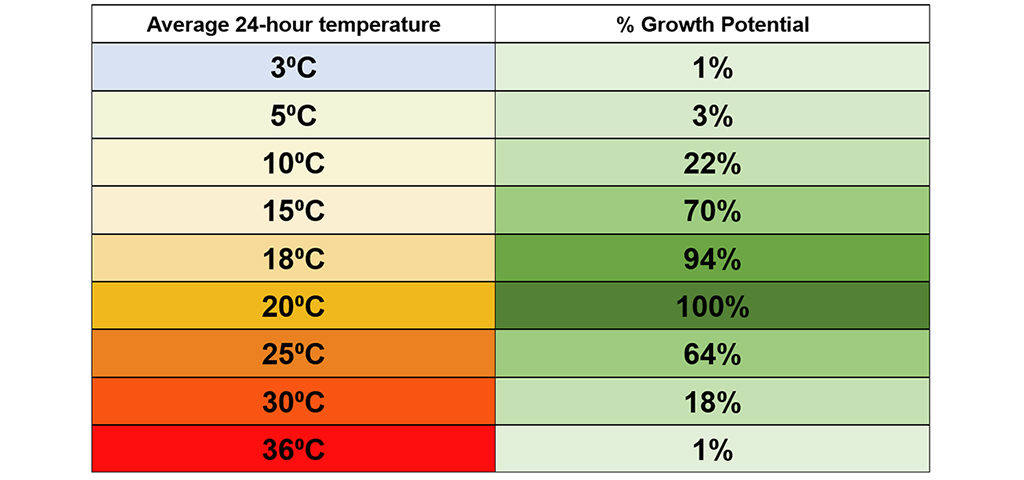
However, be aware that some variations of the model set peak growth at 18⁰C, that gives different figures; it’s important to know which one is being referred to when making decisions.
Furthermore, warm season grasses have a completely different GP curve, with very little growth until temperatures reach 15⁰C, with peak growth not reached until temperatures average 31⁰C.
Clearly ensuring you have selected the appropriate cool season grass model is crucial, along with understanding interpretation of any trials data generated for the US on warm season grasses.
This reinforces the importance of benchmarking your own situation against a GP model, to understand what the percentage figures mean for specific course situations.
Benchmarking results
Course managers regularly monitor grass clipping yield by observing the amount of clippings removed but by collecting that data they can quickly build up a picture of their own growth potential, and reference that to the conditions that influence growth. Even if that is just the volumetric measure of boxed off clipping from one green, in a graduated bucket to accurately record the litres collected every day, it is an incredibly valuable objective reference point.
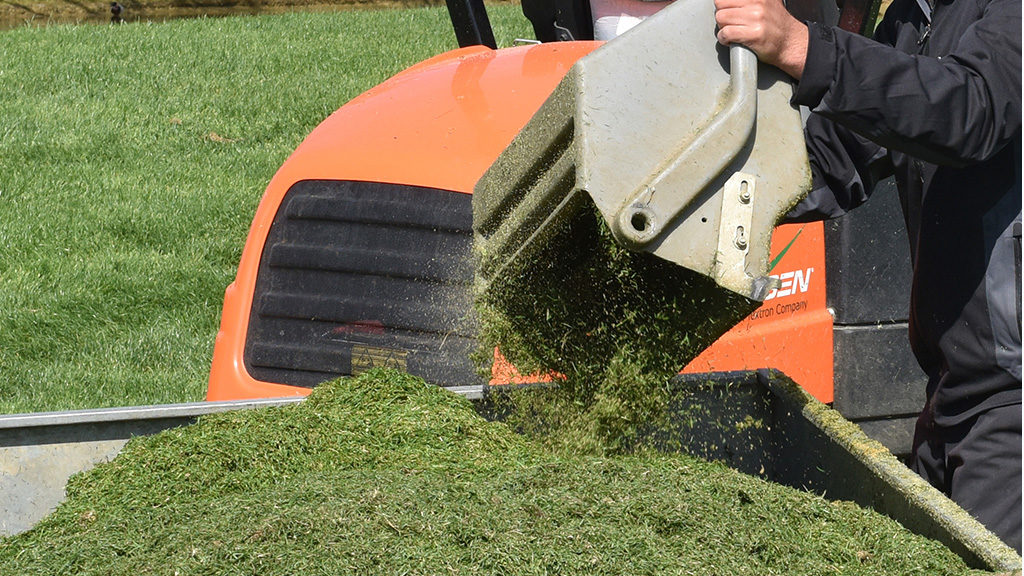
As a benchmarking tool, that physical record of grass growth can then be compared to a standardised GP model, to accurately understand and predict what the actual implication of a GP figure will be on that individual course and where other stresses may be impacting our program.
The simplicity of GP is both a strength and a limitation, it is not designed to show you the rate of growth, it is designed to highlight the “potential”. When connected with other data that becomes useful.
Since GP, as a decision support model, is only governed by air temperature, other climatic data points must be observed as the combination is what influences actual growth, factors such as rainfall, evapotranspiration and light should all be looked at when considering maintenance schedules. Other factors beyond weather also could limit turf growth, such as nutrition, sward composition, soil type, disease and stresses. These are more complicated influences, and subject to greater variance on a site specific basis, but need to be assessed and considered in combination with the GP model.
There is clear anecdotal evidence that species of grasses react differently to temperatures and would have a slightly different growth curve. Poa, for example, can be limited by cooler spring temperatures than indigenous bents and Creeping bent grass clearly has an advantage in the warmer July months. This is an interesting area that to date has not been investigated and individual growth potential models for grass species may offer some useful information in the future.
Fungicide selection
Growth potential is an extremely useful tool for appropriate fungicide selection. When there is little or no growth contact activity, which adheres to the leaf surface and prevents infection getting into the plant, can be highly effective and prolonged when the leaf is not being repeatedly cut off. At the other extreme the more systemic products, such as new Ascernity and Heritage, perform most effectively when there is growth to take up the active ingredient into the plant and move it around the plant. Between the two, there are combination products, such as Instrata Elite, that cover both aspects.
Extensive trials along with plant physiological biokinetic studies, indicate contact products, such as Medallion, are most appropriate when turf is consistently at a GP of 5% or less; the combination products containing both Systemic and contact when GP is running above 5%, and systemic products when it is consistently over 20%. The importance of using different products and modes of action appropriate to the growing conditions is to create a programme that rotates fungicide activity to optimise efficacy and an minimises risk of resistance developing.
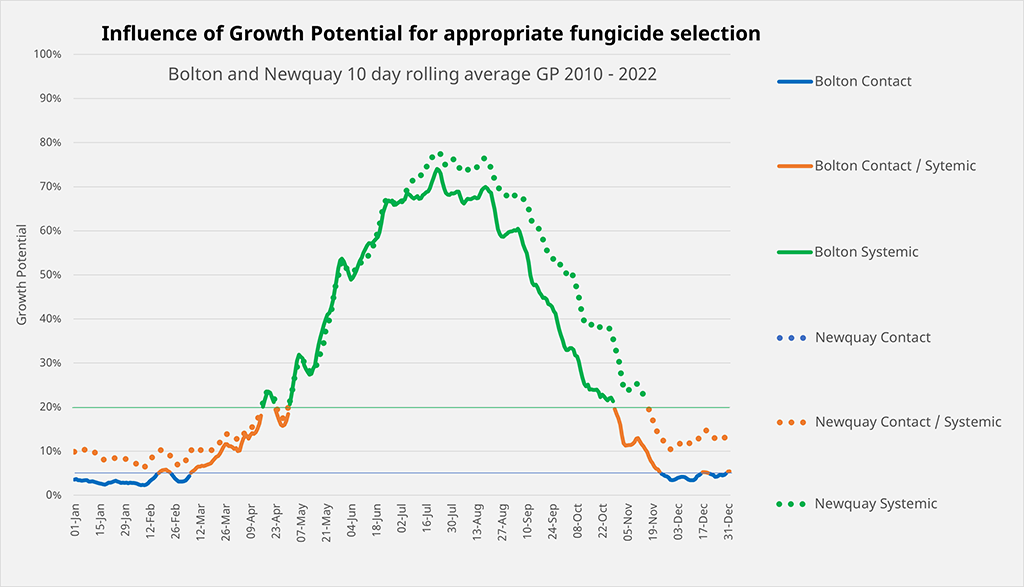
A review of historic GP figures for golf courses across the country highlights that in the far south west, for example, contact fungicides may only be suitable for very limited cold periods, with combination products having a far longer window of application in the autumn and spring. However, in central north England the GP indicates a contact fungicide would be most appropriate from mid-November in the majority of seasons and through a critical stage of early winter to retain turf cover. It also highlights how courses there could transition into full systemic products more quickly when growth does initiate, as well as for a more protracted period over the summer without the heat extremes hitting turf growth.
The key point from the analysis is the wide regional differences that occur, and the importance of looking at historical records as a guide to what is likely to happen, along with the in-season trends that will influence decisions.
Looking back on year-by-year also highlights how a short-term blip in GP could provide a valuable early warning to influence turf management actions. A short-lived warm period in winter, highlighted by a jump in GP, for example, may initiate a flush in susceptible weak growth along with a pressure point of disease pathogen activity, but insufficient strength or vigour to withstand the attack. Using disease models of pressure and risk, in combination with two-week GP trends and comparable data for the same period in previous years gives a far better picture of challenges and threats.
Resilience and recovery
The Growth Potential model also provides a valuable guide to the ability of turf to recover from any damage or stresses. When assessing disease risks, turf that is actively growing and with consistently high GP, above 70% for example, would be faster to grow out and recover from disease attacks with lower impact on turf quality. If infection occurred when turf had a growth potential of less than 20%, however, the effects could prove far more serious and longer lasting.
GP is an effective tool for greenkeepers to explain to players and club mangers why some actions cannot be implemented and why decisions have been made.
If renovations were being pushed back into late October due to player pressure, for example, historic GP figures would give clear data driven indication of the extended period of time turf will take to recover before autumn risks rise, compared to a renovation week in a less convenient, but more turf appropriate, timing in August.
One of the challenges identified in the UK has been where greenkeepers may need to sustain growth to cope with wear and possibly generate recovery at times when the GP model highlights indicates that conditions are not suitable to achieve or sustain it. That could particularly be the case over the Christmas period, when tee times are fully booked but the opportunity for recovery from that wear is severely restricted by temperature for the next 4 months.
It is something that is especially prevalent in the UK with players wanting 365-day golf, compared to the Nordics or parts of North America where courses close for the winter when no play means no active recovery is required, only to reopen when there is growth and the chance for recovery arrives. GP records, clipping yield data and seasonal trends can be crucial in helping to schedule and make the most appropriate decisions at any time of the year, but especially when conditions are most challenging.
Tracking a picture of Growth Potential is another valuable part of the jigsaw to make more proactive turf management decisions, based on data, to support greenkeepers own experiences.

