Growing Degree Days for turf management explained

As conditions warm up, Growing Degree Days, to indicate the potential growth rate of turf, are an extremely useful guide for a range of every-day management decisions - so long as you fully understand how the numbers have been calculated.
GDD (Growing Degree Days) has long been effectively and reliably used in agriculture and horticulture for calculating agronomy decisions involving plant physiology, such as lettuce crop days to harvest; soft-fruit timing from flowering to picking or fertiliser applications for crops.
Now, a new GDD calculator tool, to be launched this month on the GreenCast website, is set to provide turf managers with figures for their site, and the ability to build predictive models to aid management decisions.
Try out the new GDD Calculator here
Calculator questions
To accurately gauge the value of GDD in any specific turf situation, you have to know how the figure was calculated, especially if the figures are being used from a non-turf specific source.
In its simplest form, GDD takes the highest recorded temperature for a day, adds the lowest temperature, divides by two and then applies a base figure, judged equivalent to the onset of plant growth – which for most turf situations would be around 6°C.
So, if an April day’s high was 17°C and the low was 9°C, combined that would be 26°C, divided by two = 13°C, less a base of 6°C = 7 GDD.
The challenge is that different models will use alternative base figures, typically from 0°C to 10°C, (Table 1). In the same April day calculation example, using these base levels, the GDD could vary from 13 to zero.
GDD Model | Base figure |
Dr Bill Kreuser University of Nebraska-Lincoln | 0°C (10°C in warm season grasses) |
Mark Hunt Headland Amenity | 6°C |
Dr Karl Danneberger Ohio State University | 10°C |
Dr David Shetlar Ohio State University | 10°C |
Megan Cushnahan New Zealand Sports Turf Institute | 4°C |
Table 1. When reading GDD research it is really important to understand the base figure used for comparison to your situation | |
During winter or early spring, the simple GDD figure could be negative, so models have been revised to use a figure of 0, instead of a declining GDD if that occurs. Furthermore some modified models operate so if the minimum temperature is below the base figure, then the base figure is applied as a minimum for the GDD, since it assumes some plant physiological activity would have occurred.

The GDD algorithm can be complicated and daunting, but made easier by computer automation ( Zhou + Wang)
More recently, with increasingly sophisticated models, computer algorithms are used to take account of plant growth rates incorporating high temperature maximums. It smooths out some of the anomalies, to calculate the time plants are within the optimum growth curve conditions.
Now, advancing GDD to a new level, a Syngenta GreenCast GDD calculator has been developed to compute figures from hourly temperatures throughout the 24-hour period, compared to a simplistic daily high and low temperature conventionally used in GDD calculation.
That better reflects the duration of growing conditions through the day, for a more accurate assessment of how turf will actually perform.
Furthermore, the calculator will automatically generate a predictive email notification when a user defined GDD target is approaching – in time for greenkeepers to assess local conditions and to decide what actions to take.
The GDD Calculator does all the measurements and calculation autonomously, to provide easy to interpret information in time to use for every day decision making.
Try out the new GDD Calculator here
Whichever model is used, it is crucial to know the parameters on which it has been calculated.
Zero point start
The other key consideration is the start date, or zero point, used to calculate GDD. If the start date was March 1, it would give a very different figure compared to a calculation starting on January 1. There is no industry standard start date.
Furthermore, when using GDD to guide application intervals, everyone’s reset to zero would be different depending on their initial treatment date.
Data analysis of actual real time GDD calculations in 2019, show some of the huge variation for locality, start date and base figure for four locations across the UK.
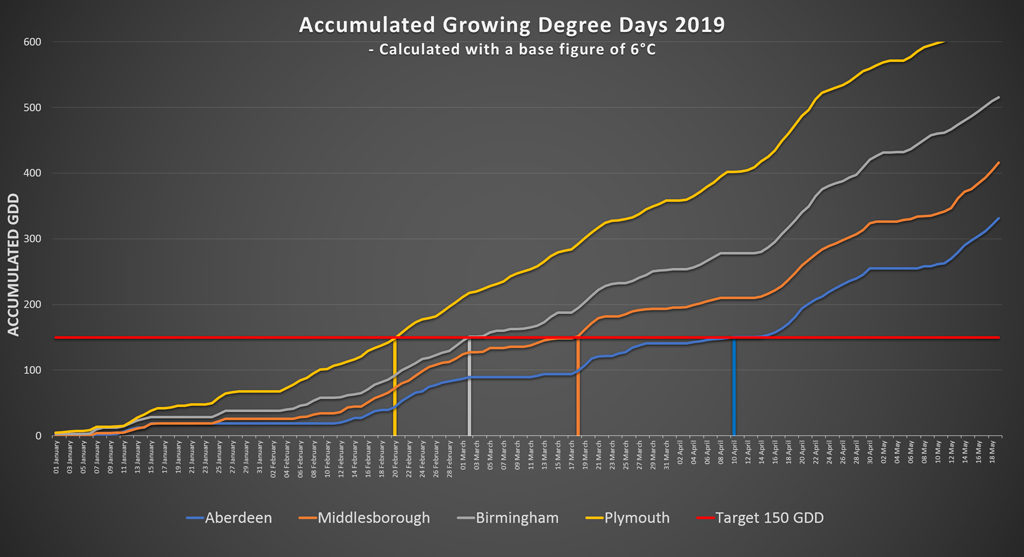
Using a simple GDD model of GreenCast real-time weather data from 2019, with a base figure of 6°C (Fig 1), the regional differences in days to reach a GDD of 150 ranged from 20 February in the south west, to the 10 April in north east Scotland.
If the base figure used had been 10°C, however, GDD 150 would not have been reached until 17 April - eight weeks later - in the south west, or 19 May in north east Scotland.
Each of the figures is factually accurate and correct, but reinforces the need to know how any GDD has been calculated for its accurate use in turf management decisions.
Primo time
In turf, GDD really became a management tool for calculating the optimum interval for Primo Maxx II plant growth regulator (PGR) programmes. Research by renowned Professor Karl Danneberger, at Ohio State University, calculated that repeating applications each time 200 GDD had been accumulated would maintain turf in consistent regulation and avoided peaks or troughs of growth.

However, the calculation had little to do with physiological aspects of turf growth. The essential premise was that as temperatures increase, the natural rate of degradation of Primo Maxx in the leaf is faster, so reapplication required sooner to maintain turf in regulation.
GDD has, and continues, to work very well when turf growing conditions are good and there are no other limiting factors on the plant, such as irrigated greens that are free draining and well fertilised throughout the summer.
But, it is important to recognise that when using GDD to calculate PGR intervals, other factors may limit growth, which would also influence Primo Maxx requirement. For example, during a hot summer GDD would indicate to apply PGR more frequently, when moisture stress on an unirrigated fairway could actually be limiting the growth anyway; in reality you would likely reduce or pause applications, and use grass growth or clipping yields as a guide to reinitiate treatments.
GDD is still a good guide. As temperatures cool in the autumn, for example, growth potential declines and regulation requirement is less, so the interval between treatments could be extended, or the rates of application reduced. It just needs to be interpreted in conjunction with practical skills and local knowledge.
GDD for disease
Grass growth, indicated by GDD, does also have some useful guidance in fungicide interval timing, since faster growth will dilute the amount of fungicide active ingredient remaining in the leaf and some will be mown off with greater clipping removal. Furthermore, most, but not all, pathogens develop faster at warmer temperatures.
However, the limitations of GDD for fungicide planning are that it takes no account of plants’ better ability to withstand disease infection when actively growing – which could alleviate the need for a treatment. Aspects of plant stress from management, weather, available light and periods of wet and dry also need to be taken into account, along with disease forecast models to predict risk periods.
Furthermore, every product has a different decline rate of natural degradation in different conditions and temperatures, which influences its effective longevity (See GI Insight feature – How long will my fungicide last?).
The GDD calculation needs to be considered in conjunction with the experience of a previous fungicide application’s persistence, along with a disease forecasting model that will indicate the climatic risks of infection for a specific course’s integrated turf management programme.
Recording key disease events and cross referencing them to GDD records for your course is a great way to begin building a site specific model that reflects your management style and conditions.
Pest modelling
Temperature is a key factor in pest development. GDD has proven a very useful tool in predicting damaging annual bluegrass weevil activity in the US, with WeevilTrak, along with better targeting of Acelepryn applications.
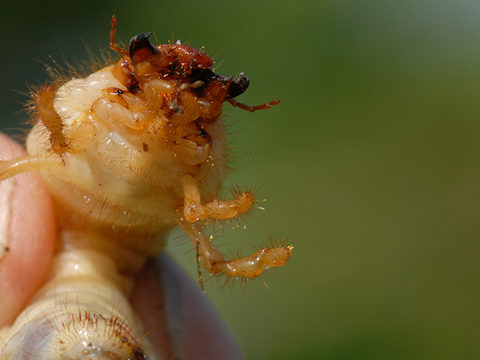
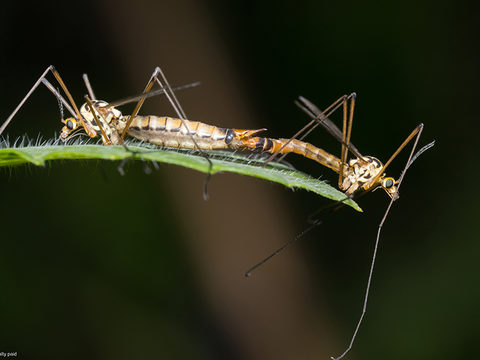
Whilst it is soil temperature that influences chafer grub and leatherjacket movement, establishing a GDD figure for when adult winged emergence is likely to occur will be another valuable tool for risk assessment and control options. As more data is gathered to document specific insect pest hatch times, potential models can be validated against real life conditions.

Get more on the GDD Calculator and how to use it on the GreenCast Advisory blog


